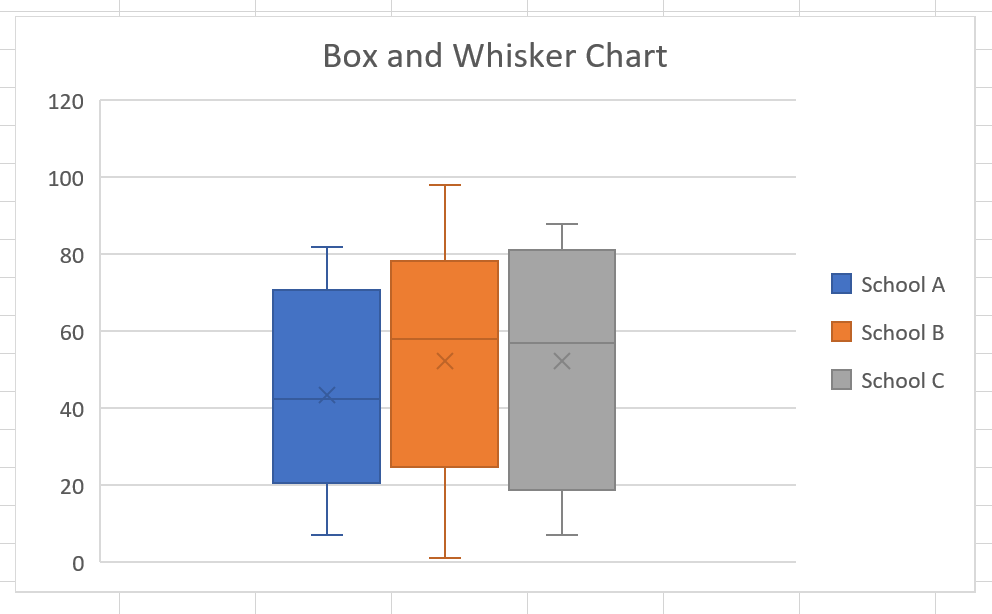
In Excel 2016, Microsoft added Box and Whisker Charts. With this new feature, Microsoft has published a support document detailing How to Create a Box and Whisker Chart. These instructions are great if we already have data formatted into such an a table, but what if we're pulling data out of a table in SQL Server? Let's build a query that will generate a suitable result set for plugging right into Excel.
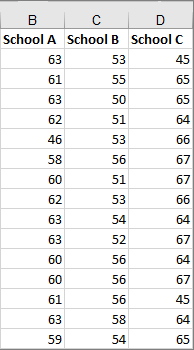
First, here's the format that Excel is looking for:
Let's assume we have the following table:
CREATE TABLE TestScores (
  School nvarchar(63) NOT NULL,
  TestScore int NOT NULL
)
We need a way to pivot our data without aggregating any values. We can do this using the ROW_NUMBER function.
SELECT  [School A], [School B], [School C]
FROM    (
  SELECT  School,
          ROW_NUMBER() OVER (PARTITION BY School ORDER BY TestScore DESC) AS R,
          TestScore
  FROM	TestScores
) t
PIVOT( MAX(TestScore) FOR School in ([School A], [School B], [School C]) ) p
This produces the following table (with random dummy data):
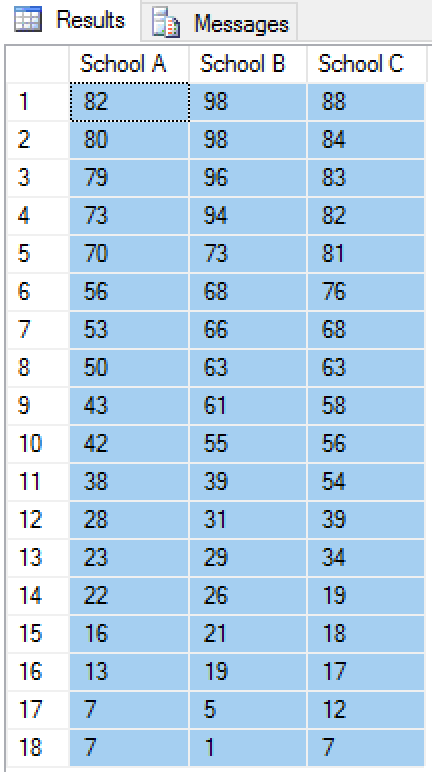
From here, copy and paste into Excel and you've got your Box and Whisker Chart: